INTRODUCTION
To determine data set and have the favourable outcomes on which firms implicate various measuring techniques. There are mainly use of accounting, financial and statistical tools. However, implicating such techniques which gives appropriate analysis through all the operational framework. Moreover, in the present assessment there will be determination of various facts and figures which comprises with the statistical data. It consists of analysing the data set which contains the detailed annual salaries of male and female workers in the private and public sectors of jobs. There will be measurements of the order quantity based on Economic Order Quantity technique which ascertains the reorder level of organisation. The influences of mean, mode, median techniques will bring the appropriate outcomes to the researchers on which they will generate appropriate decisions and changes in operational activities.
Increase Your Odds of Success With Our
- Scholastic academic documents
- Pocket friendly prices
- Assured reliability, authenticity & excellence
ACTIVITY 1
A Information related to annual earning
- Gross annual earning in public and private sector:
In the public and private sector there is small but positive changes in gross annual salaries from the year 2010. There is drastic and strong effect in wages which are acquired by male and female employees in public and private sector such as:
Male Workers
|
Year |
Private |
% change in yearly wages |
Public |
% change in yearly wages |
|
2010 |
31254 |
27000 |
||
|
2011 |
31380 |
0.40% |
27233 |
0.86% |
|
2012 |
31816 |
1.39% |
27705 |
1.73% |
|
2013 |
32541 |
2.28% |
28201 |
1.79% |
|
2014 |
32878 |
1.04% |
28442 |
0.85% |
|
2015 |
33685 |
2.45% |
28881 |
1.54% |
|
2016 |
34011 |
0.97% |
29679 |
2.76% |
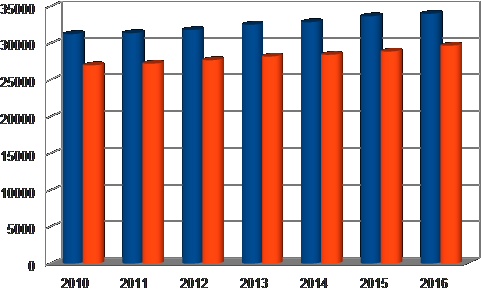
Interpretation: In the above scenario, it has been clearly viewed that there is significant change in the salaries of male employees during the year 2010 to 2016 (Giordano, and.et.al., 2011). The difference in the figure of male employees of public sector is comparatively high from the private sector in context of salaries too. In the similar aspect, it has shown gross annual earnings in public and private sector. This picture gives an indication about self employment and private employment will always help in generating specific and perfect wealth to the people. On the basis of analysing the percentage change in annual salaries of male employees of both public and private sectors. The percentage change of private sector in 2011 was 0.40%, 2012 was 1.39%, 2013 was 2.28%, 2014 was 1.04%,2015 was 2.45% and in 2016 it was 0.97%. In the same series, the percentage change of public sector in 2011 was 0.86%, 2012 was 1.73%, 2013 was 1.79%, 2014 was 0.85%,2015 was 1.54% and in 2016 it was 2.76% (Gastwirth, 2014). In the process of analysing these variations, the earning capacity of male employees has major fluctuating changes in their annual earning.
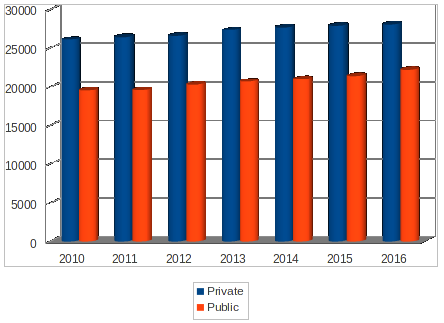
Interpretation: The above data set is depicting the picture about the figure of female employees in public sector and private sector with the percentage change of yearly wages. The economy consists of huge proportion of female workers in both public and private sector. The above figure states the proper analysis of yearly wages of female employees and percentage change of salaries from year to year. Change in yearly salaries of female employees of private sector was traced in above tabular format. In every year gap change in annual salary is increasing but in 2016, it rose by huge variation such as 3.96% from 1.84%. From the above scenario it has been clearly viewed that private sector has more female employees as compare to public sector and in the perspective of salary public sector is increasing more changes annually (Gravetter and Wallnau, 2016).
- Variations and gap between yearly earnings of male and female
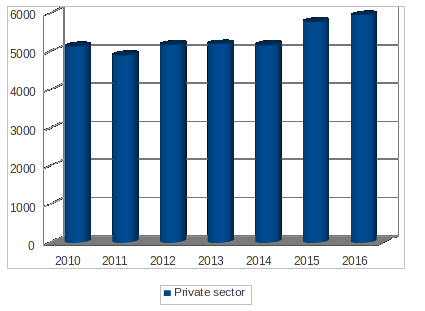
Interpretation: The above picture replicates about the variations and gap between the male and female employees of private sector. According to the capacity along with the period there is presence of gap between annual earnings among male and female employees. With the above picture it has been stated that male employees are higher than female employees in private sector and even male employees have the ability to generate more revenue as compare to female. The gap has been identified from the year 2010 to 2016, as it was approx xonstant timm year 2014 but in 2015 and 2016 there is huge gap in private sector of working males and females. These figure easily states that gap is increasing year by year so this is directly linked towards earning efficiency of the employees which is increasing rapidly. But as compare to male employees, female employees are reducing in private sector and even they have low wages (Lee, 2012).
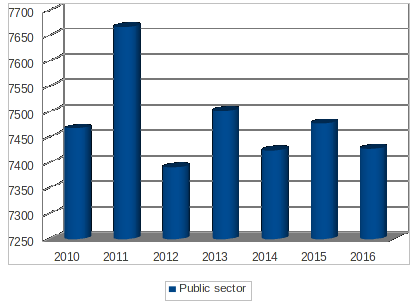
Interpretation: The above diagram gives us the critical understanding about the variations and gap between the earning tendency of male and female during the period in public sector. With this it can be elaborated that there is large gap between the salaries of both male and female workforces. Practically the gap is in form of number in the wages of employees of public sector was higher in 2011 but it reduced in 2012 and trend continued till year 2016. These figure gives the picture that there is no such variations or gaps between male and female employees earning with the context of public sector. By comparing earning capacity of public sector with earning capacity of private sector, public sector signifies huge gaps in salaries of male employees and female employees. There might be the presence of gap in salaries but there earnings remain constant, as such there are no sudden changes.
B Analysis of gross annual earnings by industry sector on National statistics website
1. Identifying the variations between education and finance.
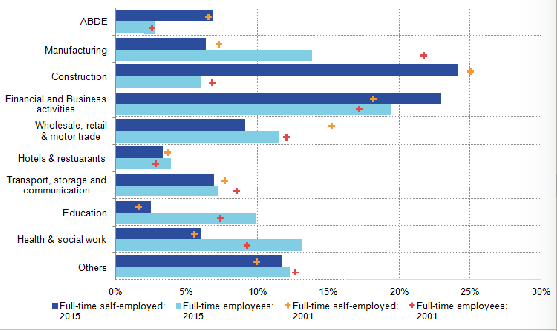
Interpretation: In the above graph, the gap between education sector and finance sector can be easily analyzed because of huge gap in the UK economy (Wang, Yang and Wang, 2012). Global Financial crisis has provided a huge impact on government plans and policies and on the contrary side domestic development of nation has been improved. Generally there are two types of employment in various fields such as part-time employment and full-time employment. While comparing growth of financial sector with education sector, financial sector is growing more than educational sector. In the same series full-time employment is leading the list (Grissom and Keiser, R., 2011).
2. Brief understanding about analysis of administrative staff and health and social care staff.
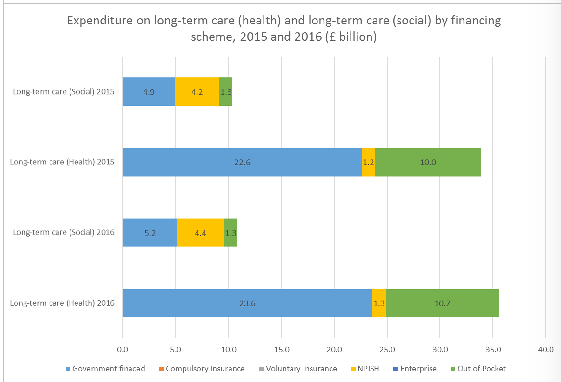
Interpretation: The above chart signifies about various information which is helping in the analysis of fruitfulness of social care sector and health sector and even administrative departments. Higher growth can be observed from the perspective of long term health and social care services. For improving health care department, the UK government should be able to make plans according to this. It will lead to have sufficient amount of increment on the basis of growth and profitability. Usually the revenue which has been generated should be retained by country which are mainly via services and efforts which are made by health and care department.
ACTIVITY 2
- The hourly payment of various regions in UK
There is proper estimation and analysis of hourly payments in the various region of UK, for determining of the statistical measurements in the context of proposed data set. Statistical techniques like mean, mode, median and standard deviations (Turkyilmaz and.et.al, 2011).
2.1.A Median estimate
Mean
Median
Interpretation: The above table gives an analysis of Ogive chart, which is measuring specific mean, mode and median analysis. This is measuring the earning capacity such as workers who worked below 10 hours has margin capacity of 8%, the revenue generated is 46% of worker who worked 10-20 hour, between 20- 30 hours has produced revenue of 26%, between 30-40 hours has produced revenue of 14% and between 40-50 hours has generated revenue of 6%. In the same series the median analysis is 19.13 gives a result that 10-20 and 20-30 hours workers are creating more efficiency and revenue as compared to other category of workers. The mean value of 21.4 giving a positive side for determination of fruitfulness of sales personnel earnings (Shonin, Van Gordon. And Griffiths., 2014).
2.1.B Standard deviation
Interpretation: The above table gives us the analysis of standard deviation of the given data set as per hourly work done by the employees of South east workers (Wan, Wang and Tong, , 2014). The mean value of the given data set is 21.4 which will be proper for analysis. The data set gives the standard deviation of 10.15 which is less than compared to mean of the data set. Thus, it is giving positive side that margin of labor force who are working hourly is appropriate.
- Comparison of earnings of two regions
Interpretation: For the proper analysis of the earning capacity by statistical measurements of two regions of UK can be done by mean, median and standard deviation of North west employees and South east employees. During the analysis it has been clarified that South east consists of more efficient employees as compared to North west region. The mean value of North west and South east is 16.70 and 21.4 respectively, so mean value of south east is more favorable in the prospective of better earnings and generating more revenue by the employees. The outcome of standard deviation of both regions has major variations, north west and south east as 7.4 and 10.15 respectively and in same series median value of this region are 14.50 and 19.13 respectively (Philippon and Reshef, 2012). So it can be said that there are various changes in the outcomes. But on the basis of median analysis, north west consists of more efficient workers. But in the overall analysis South east region has the perfect growth and has more capability for generating revenue.
ACTIVITY 3
A Analysis the numbers of annual deliveries made by suppliers
In order to analyse the level of deliveries of rice bags made by suppliers in an operational period to the supermarket, there will be implication of various techniques which will be helpful in ascertaining the adequate analysis of the facts (Kuppuswamy and Bayus, 2018). Moreover, it will be beneficial to the professionals in order to analyse the efficiency of and cost effectiveness in business. Thus, the measurements are as follows:
|
Details |
Outcomes |
|
No. of days (annually) |
365 |
|
Supermarket off for |
5 days |
|
Total annual delivery |
365 – 5 = 360 days |
|
No. of days delivered |
12 |
|
Industry made 30 deliveries annually |
360 days /12 days = 30 deliveries
|
Interpretation: By considering the efficiency of business and suppliers it has been analysed here that the suppliers are efficient in terms of making the 30 deliveries in an operating period. The analysis is based on considering various conditions such as 5 days in a year the supermarket has been closed in a year which ascertains that there are 360 days of working. Moreover, there are 12 days on which the suppliers made deliveries to the supermarket. Thus, it comprises with the outcomes that there are total 30 deliveries of rice bags has been performed by suppliers.
B Number of bags were being delivered in each period
In relation with analysing the numbers of deliveries made by the rice bag suppliers in a year. There will be need to analyse the numbers of bags which being delivered by them (Padon, Maloney and Cappella, 2017). Therefore, in consideration with the previous outcomes there will be measurements of no. of products which were being supplied by them.
|
Details |
Outcomes (In £) |
|
Yearly demands |
450000 |
|
No. of deliveries |
30 |
|
No. of bags (in each delivery) |
15000 |
Interpretation: By considering the previous analysis based on determining the number of deliveries made by the suppliers in a year which is 30 supplies. Thus, in relation with such derived outcomes there will be measurement of numbers of bags which were being delivered in a year. The annual demand for bags are 450000 which being received by the business professionals. Thus, in order to satisfy this demands there will be rise in the production level. In relation with those 30 deliveries and consumer requirements there are 15000 bags were being supplied by the suppliers in the business. Moreover, it insists that there will be deliveries of 15000 bags in each supplies.
C Identifying the EOQ
Economic Order Quantity: The analysis based on determining the EOQ level of the business which will be assistive in relation with measuring the operational efficiency of entity. Thus, these are the volume of production quantity which are needed to be added in each batch which will reduce the costs of order, holding the inventories. It will be a helpful tool in order with suggesting the appropriate techniques which will be effective in reducing the costs of controlling the inventories (Economic Order Quantity, 2018). Moreover, the following stated measurements reflect the changes in the order quantity as well as productive efforts which are needed to be made by business.
|
Details |
Outcomes |
|
Requirement For Rice bags annually |
450000 |
|
Ordering cost |
£20 |
|
Holding cost |
2 * 25% = 0.5 |
|
Economic order quantity |
√2 * 20 * 450000 / 0.50 = √360000 = 6000 bags |
Interpretation: On the basis of various analysis the economic order quantity has been made by the firm in the period which ascertains that there are 450000 bags were annually demands generated in organisation. Thus, it requires the ordering costs of 20 pounds as well as the holding costs is 0.5 per order. One the basis of such variables and elements there will be measurements of EOQ level of the business which is 6000 bags. Therefore, it can be said that if the firm make increment of 6000 bags in than there will be reduction in the holding cost, ordering costs etc. Thus, in relation with managing the costs incurred in each business operations there will be need to have changes in the production capacities as well as proper administration of the industrial operations.
D. Recommendation for total variable cost model
|
EOQ |
6000 bags |
|
|
Annual deliveries |
450000 |
75 times |
|
6000 |
|
Current techniques |
New techniques |
|
|
Avg, Stocks |
1/2(0+15000) = 7500 bags |
1/ 2 (0+6000) =3000 bags |
|
Annual holding cost |
7500* 0.50 = 3750 |
3000* 0.50 = 1500 |
|
Annual delivery cost (No. of trips * 20) |
20*30 = 600 |
20* 75 = 1500 |
|
Total Costs |
4350 |
3000 (Cost efficient) |
Interpretation: On the basis of above measurements there has been analysis based on determining the fruitfulness of various costing and operational techniques. Moreover, in relation with such analysis there are various operations which in turn will be indicative and helpful as to have proper determination of the effective technique which is needed to be implicated b by the professionals. Thus, in accordance with the current polices of the business where the average stock as been analysed as 7500 bags, holding costs as 3750 and cost of deliver as 600 which together identifies the overall costs for 4350. Thus, it can be said that in order to meet the requirements of 15000 in each delivery there will be cost of 4350 which were has to payable ya the suppliers. On the there side, in consideration with the new techniques which consists of the average inventories of 3000 bags, holding costs as 1500, costs of deliveries will be 1500 which bring the total outcomes at 3000. Thus, it can be said that, the new policies will have effective results and which will be cost efficient to the business in order to have the appropriate administration of the costs incurred in the business operations.
ACTIVITY 4
A Preparation of line chart which identifies the gross earning of male and female workers during 2010 to 2016
The Private sector:
Interpretation: On the basis of above presented line chart which reflects the earning capacity of male and female employees in the respective year form 2010 to 2016 which will be compared as to have proper strategic plan. The growth in remuneration generation from both the employees are on comparatively same proportionate. Only, the difference is in the revenue generation level of these employees (Rice and et.al., 2017). It comprises with the outcomes that the male workers are more efficient in earnings than the women employees.
The public sector:
Interpretation: By considering the above line chart it can be demonstrated here that the gap between earnings of male and women employees in the respected years is comparatively more than the private sector. Thus, the difference is due to the earning efficiencies and productive efforts made by women worker is comparatively lower than male workers. Moreover, there is need to make changes in the employment level by government as to promote the women employees more to the operations. It requires planning and enforceability of various terms and polices which will be helpful for improving the earning scale in the country.
B. Presentation of Ogive chart which identifies the cumulative % of sales.
Interpretation: The above listed ogive chart which states the hourly work done by UK sales personnel which will be based on the cumulative efforts made by them in operations. In the category and 0-10 hours working efforts made by the professionals are mainly incorporated with the 8% of cumulative efforts, 10-20 hours where 54%, 20-30 is 0% and 40-50 is 94%. Therefore, in relation with such outcomes it can be said that 10-30 hours in a week will be most effective and accurate as to have proper determination of the facts.
Set in Motion the Plan for Exemplary Grades with Our Extensive Academic Writing Services
Premium Assignment Services
CONCLUSION
By considering the study made above it can be concluded that the use and implication of various statistical techniques which will be effective for analysing the accurate outcomes. Therefore, these are the techniques which approaches towards making changes in operational activities, policies and techniques of the business. Further, there has been application of various statistical techniques such as mean, mode, median, standard deviation, EOQ analysis etc. which represents the clear and accurate analysis over the facts.
You may also like to read:
Strategic Thinking And Value Management Samples
Skills That Are Required to be an Outstanding Manager
Managing Strategy, Operations And Partnerships
REFERENCES
- Gastwirth, J. L., 2014. Median-based measures of inequality: Reassessing the increase in income inequality in the US and Sweden.Statistical Journal of the IAOS. 30(4). pp.311-320.
- Giordano, R., and.et.al., 2011. The public sector pay gap in a selection of euro area countries.
- Gravetter, F. J. and Wallnau, L. B., 2016.Statistics for the behavioral sciences. Cengage Learning.
- Grissom, J. A. and Keiser, L. R., 2011. A supervisor like me: Race, representation, and the satisfaction and turnover decisions of public sector employees.Journal of Policy Analysis and Management.30(3). pp.557-580.
- Lee, Y. J., 2012. Behavioral implications of public service motivation: Volunteering by public and nonprofit employees.The American Review of Public Administration.42(1). pp.104-121.
- Philippon, T. and Reshef, A., 2012. Wages and human capital in the US finance industry: 1909–2006.The Quarterly Journal of Economics.127(4). pp.1551-1609.
- Shonin, E., Van Gordon, W. and Griffiths, M.D., 2014. The treatment of workaholism with meditation awareness training: A case study.Explore: The Journal of Science and Healing,10(3). pp.193-195.
- Turkyilmaz, A., and.et.al, 2011. Empirical study of public sector employee loyalty and satisfaction.Industrial Management & Data Systems.111(5). pp.675-696.
- Wan, X., Wang, W., Liu, J. and Tong, T., 2014. Estimating the sample mean and standard deviation from the sample size, median, range and/or interquartile range.BMC medical research methodology.14(1). p.135.
- Wang, Y. D., Yang, C. and Wang, K. Y., 2012. Comparing public and private employees' job satisfaction and turnover.Public Personnel Management.41(3). pp.557-573.
- Kuppuswamy, V. and Bayus, B. L. 2018. Crowdfunding creative ideas: The dynamics of project backers. In The Economics of Crowdfunding (pp. 151-182). Palgrave Macmillan, Cham.
- Padon, A. A., Maloney, E. K. and Cappella, J. N. 2017. Youth-targeted e-cigarette marketing in the US. Tobacco regulatory science. 3(1). 95-101.

UPTO50%
Avail The Benefit Today!
To View this & another 50000+ free