INTRODUCTION
The present study is giving brief discussion about various business decision tactics and its importance in current market. The present report is giving brief discussion about primary and secondary research of reasons which are impacting on high street shops and malls due to technological innovation and evolution phase of multi channel shopping. It is extracting issues because of different reasons for change and platform for shopping has been used and its impact because of socio economic. This topic has framed questionnaire for gathering data with appropriate survey methodology and sampling frame. There is representation of arithmetic mean mode and median of that specific response of survey and it has been analysed with appropriate conclusions. In this report findings are represented in spreadsheet and it has been elaborated in graphic format. There is presentation of trend line of minimum period of 3 year of Debenhames Plc. In the last task, some information system which are used for process of decision making with their essential features in context of business. Further it has mention network diagram by assessing its critical path and various financial tools used for decision making such as net present value and internal rate of return.
Increase Your Odds of Success With Our
- Scholastic academic documents
- Pocket friendly prices
- Assured reliability, authenticity & excellence
TASK 1
1.1 Determining plan for collecting data
There are various concepts in context of advancement of technology and its innovation which are pertaining to retail sector. The business environment consists of different alterations of trend line for accomplishing goals and they are replicated as a competitive element in nature.
Subject: To identify consequences due to innovation in technology and multi-channel shopping on the basis of various customers and sales.
This specified research paper will be reflecting issues related to our subject as it has basic requirement of secondary and primary data with perspective of researcher.
Primary data: It consists of information which is extracted from focus group, survey, observation, etc. which will be having its applicability for attaining the specific subject of this research. The extracted information which is very appropriate and suitable will be giving effects in huge proportion to its outcomes. In this research, there is requirement of information in context of shopping habits and customer preference for accomplishing objective and for recording the changes (Hajdu, 2013). In this specific retail sector, survey technique will be used. One of the best measures in context of high street malls and shops is referred as purposive sampling and it will be taking sample of 30 managers. After the appropriate selection of technique, it will move towards next step which is drafting questionnaire of both types of questions i.e. open ended and close ended and it will be directly linked to shopping habits and alterations in same context. The questionnaire which is drafted will be given to those managers (30) and persons who have direct link to our objective of specific research. The extracted data will be directly linked to plan and most of the information will be gathered from scholar and from authenticate resources.
Secondary data: It consists of data which is already published, interpreted, classified and analysis performed by other researcher. There are various issues and their solutions are extracted from journals, articles, scholarly papers and journals. It includes the full disclosure of data and trend of multi-channel shopping as it is providing significance level of every customer which will be according to the latest information about data of customers in context of shopping from retail outlet and trends which is followed. Internet is referred as one of the best and possible ways for collecting information in context of past behaviour of customer and shopping trend.1.2 Survey methodology and sampling frame
Survey Methodology: It is referred as the most important stage which cannot be avoided by any manager as this gives specific justification of performance in an efficient aspect. For performing research, specific time period is chosen and it lays special focus on choosing the method for applying it accordingly (Rosqvist and Hiselius, 2016). The consequences of technological innovation on sales and customer base of retail outlet are highlighted in this and responses will be recorded according to malls from manager of company which is through online survey. The main aspect of implying this online survey methodology is that it helps in saving time and its outcome are very efficient.
Sampling Frame: It should be chosen in context of topic of survey and selection of sample should be in same manner. The application of sampling should be according to probabilistic and non-probabilistic technique. The sample should be selected in context of aim and subject or research in non-probabilistic technique and on its contrary, probabilistic technique selects all the individuals whosoever is linked with research as sample. The present research is performed by adopting technique of purposive sampling by choosing 30 managers who are giving possibilities for perfect match for qualitative type of research and its recommendations will be directly based on solutions of mentioned issue.
1.3 Preparing questionnaire for collecting data
While preparing questions in context of survey should be very indicative in nature as it must provide efficient outcomes. The questions must be linked to basic subject of this research as it consists of both close and open ended questions (Daigle, 2016).
|
Demographic information Name: Gender:
Profession:
Age
Annual income
1.Does shopping habits of customer changes with time?
2.How much you agree that there is decrease in sales trend of revenue with perspective of retail products and services?
3.Do you agree that online stores are given with more preference than physical high street shops and malls?
4.How often annual income gives impact on shopping habits of customers?
5.Which factor is considered as the most essential for changing shopping habits?
6.Do you think trend of working women gives important factor for changing shopping habits while shopping?
7.Select the range which you will spend on online purchase for per year.
8.Give some suggestions for increasing performance of sales and to increase customer base? |
TASK 2
2.1 Interpretation of data from survey
|
Respondents |
Question 2 |
Question 3 |
Question 5 |
|
1 |
1 |
1 |
3 |
|
2 |
2 |
1 |
2 |
|
3 |
1 |
2 |
1 |
|
4 |
4 |
2 |
3 |
|
5 |
1 |
1 |
2 |
|
6 |
2 |
1 |
2 |
|
7 |
3 |
2 |
3 |
|
8 |
1 |
1 |
3 |
|
9 |
2 |
2 |
3 |
|
10 |
4 |
1 |
3 |
|
11 |
1 |
2 |
3 |
|
12 |
1 |
2 |
3 |
|
13 |
1 |
1 |
1 |
|
14 |
3 |
2 |
3 |
|
15 |
2 |
2 |
2 |
|
16 |
1 |
1 |
3 |
|
17 |
5 |
2 |
1 |
|
18 |
3 |
2 |
3 |
|
19 |
2 |
1 |
3 |
|
20 |
1 |
2 |
2 |
|
21 |
5 |
1 |
3 |
|
22 |
3 |
1 |
1 |
|
23 |
2 |
1 |
3 |
|
24 |
1 |
1 |
1 |
|
25 |
5 |
2 |
1 |
|
26 |
3 |
2 |
3 |
|
27 |
1 |
1 |
1 |
|
28 |
2 |
1 |
1 |
|
29 |
1 |
1 |
3 |
|
30 |
1 |
1 |
3 |
|
Theme 1 |
Theme 2 |
Theme 3 |
|
|
Mean |
2.1666666667 |
1.4333333333 |
2.3 |
|
Standard Error |
0.2448707533 |
0.0920186554 |
0.1601005431 |
|
Median |
2 |
1 |
3 |
|
Mode |
1 |
1 |
3 |
|
Range |
4 |
1 |
2 |
|
Minimum |
1 |
1 |
1 |
|
Maximum |
5 |
2 |
3 |
|
Sum |
65 |
43 |
69 |
|
Count |
30 |
30 |
30 |
Interpretation: The above table is depicting descriptive analysis of 30 managers who were selected as sample of whole population about the research subject. The analysis which is presented by selecting some important question of the whole scenario which are giving huge impact (Gallo, 2016). The behaviour pattern has been traced by highlighting the important insights of customer towards shopping in physical store. The specific subject of research can be briefly viewed by question 2, 3 and 5 which are replicated above by theme 1, 2 and 3 respectively. Theme 1 is depicting about declining trend of sales revenue because of retail products and services. By evaluating mean of every individual who are leaning towards different statement of revenue decline is represented annually. Theme 2 is depicting about preference of online stores over retail outlets whose mean is 1.43 which means high preference towards online stores as compared to retail outlets. In the same series theme 4 is interpreting most important concept of this study as relevance of most important factor whose mean is replicated as 2.3 as it has identified the preference fluctuations that is given inconvenience and followed by discount and then comparison.
2.2 Interpretation and analysis of outcomes with context to conclusions
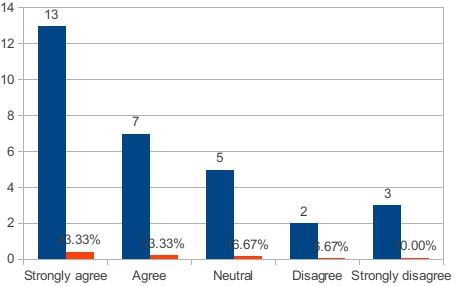
Theme 1
Interpretation: The outcome of survey is giving indication that 43.33% and 23.33% people agree that there is decline in sales of high street malls and shops because of innovation of various technological advancements in retail sector. 16.67% disagree that it is not reducing as technology is not impacting it as they are blaming economic condition. The retail sector has been changed by entering of online websites in shopping which is drawing negative aspect in performance of organization.
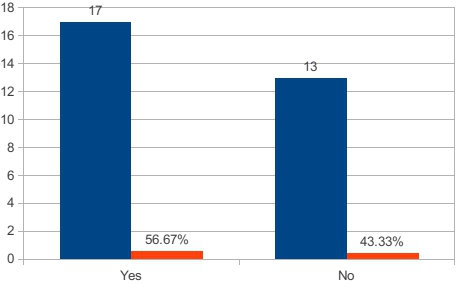
Theme 2
Interpretation: It is reflecting outcome of question 3 as it is depicting clear view that majority people are giving more preference to online websites for purchasing products and services instead of physical high street malls and shops. But on its contrary 43 percent population disagree with preference of online store due to lack of trust, loyalty and sensuality of products and services.
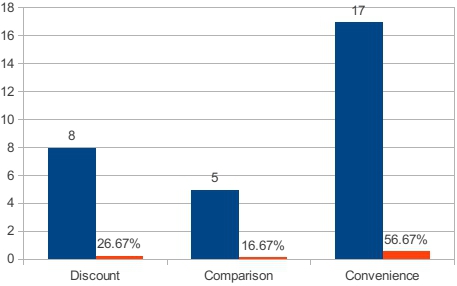
Theme 3
Interpretation: This theme refereed as backbone question of survey, as it is directly emphasizing factor for huge preference to online stores. There is presence of 57% who prefers online stores due to convenience factor as in the present era people have very complex working schedule so for more comfort zone they prefer this. There are 27% people who buys goods and service because of discount as there are very rational people and 17% person has objective of creating comparison about their services and products.
2.3 Application of dispersion for data interpretation
Standard deviation: It is referred as statistic which measures data set's dispersion in context to mean and it comes to square root of respective variance. If there is presence of huge spread from data points to mean then there are huge deviation in that specific data set and thus more spread out of that data then standard deviation is higher. It specifies range in huge and less volume.
Variance: It is replicated as one of the most essential statistic measure for quantifying difference of various observations in context of each other. In simple words it is defined as deviation of actual expense from amount which is budgeted and forecasted (Gong and et. al., 2018).
Result of variance and standard deviation
|
Theme 1 |
Theme 2 |
Theme 3 |
|
|
Standard Deviation |
1.3412 |
0.5040 |
0.8769 |
|
Sample Variance |
1.7989 |
0.2540 |
0.7690 |
|
Kurtosis |
-0.1593 |
-2.0621 |
-1.4025 |
|
Skewness |
0.9613 |
0.2834 |
-0.6509 |
Interpretation: The standard deviation of all three themes are taken as priority and there outcome has been interpreted as mean of theme 1 and theme 3 and its standard deviation has huge spread so there is decrease in sales trend of revenue with perspective of retail products and services. Theme 2 has huge spread so mean value is farther away from data set.
2.4 Drafting conclusion by using quartile and percentile
Quartile: It is referred as one of type of quantile, usually it divides whole data into three points as lower quartile, median and upper quartile. Usually it is used for setting outliers of data set.
Percentile: Generally it is used in statistics for measuring the value which is below specific percentage of observations in that particular group.
|
Particulars |
Theme 1 |
Theme 2 |
Theme 3 |
|
Quartile 1 and 25th percentile |
1 |
1 |
1.25 |
|
Quartile 2 and 50th percentile |
2 |
1 |
3 |
|
Quartile 3 and 75th percentile |
3 |
2 |
3 |
Interpretation: It is replicating quartile and percentile which is giving its outcome and it can be elaborated as while consuming goods and services they get more influenced by convenience factor so its major recommendation is in specific sense that product line and its design should be unique and developed related to customer preference and they must locate physical outlets near residential area (García-Peñalvo and Conde, 2014).
TASK 3
3.1 Representing outcome of survey through spreadsheet
Theme 1
|
Serial number |
Particulars |
Figure |
Percentage |
|
1 |
Strongly agree |
13 |
43.33% |
|
2 |
Agree |
7 |
23.33% |
|
3 |
Neutral |
5 |
16.67% |
|
4 |
Disagree |
2 |
6.67% |
|
5 |
Strongly disagree |
3 |
10.00% |
|
Total respondents |
30 |
100.00% |
Theme 2
|
Serial number |
Particulars |
Figure |
Percentage |
|
1 |
Yes |
17 |
56.67% |
|
2 |
No |
13 |
43.33% |
|
Total respondents |
30 |
100.00% |
Theme 3
|
Serial number |
Particulars |
Figure |
Percentage |
|
1 |
Discount |
8 |
26.67% |
|
2 |
Comparison |
5 |
16.67% |
|
3 |
Convenience |
17 |
56.67% |
|
Total respondents |
30 |
100.00% |
3.2(b) Providing graph along with trend line of growth of sales and profit
The brief analysis has been done by observing sales and profit of Debenhams which has been incurred by different operation. The analysis has been performed by framing trend line and bar graph. There are sudden fluctuations in sales and profit which are directly viewed below. The data is extracted from secondary sources as from annual report of Debenhams Plc. The specific time period has been observed such as 2017 – 2017 (Åžen, 2017).
|
Year |
Sales (GBP) |
Cost (GBP) |
Profit (GBP) |
|
2014 |
2312700 |
2033400 |
279300 |
|
2015 |
2322700 |
2023500 |
299200 |
|
2016 |
2341700 |
2039800 |
301900 |
|
2017 |
2335000 |
2046100 |
288900 |
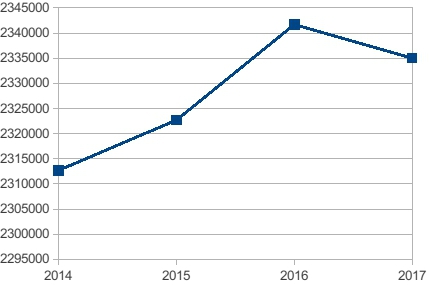
Interpretation: The trend line has been represented in above picture of sales of four consecutive year such as 2014 – 2017. The variation between sales of 2014 and 2017 has huge spread which involves so much of ups and down and usually all was because of operations. In 2014 there was deficiency of operations and poor internal control and marketing. From year 2014 to 2016 it had taken drastic change in managing its operations and marketing policy. But due to some internal problems and competitors sales of 2017 got decreased so it must keep watch on there policies (Debenhams Plc, 2018).
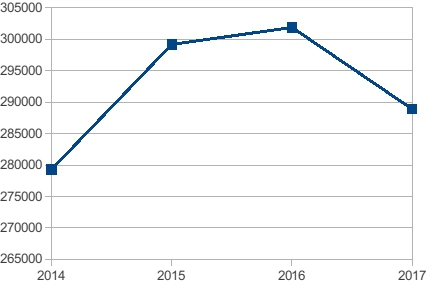
Interpretation: The above trend line is depicting profit of Debenhames Plc. Of time span of 2014 – 2017. The best year of this organization was 2016 in terms of profit. In 2014 it was not able to generate sales so it did not work on concept of margin as well. There was problem of managing its operations and lack of efficiency. While in 2015 it started managing its operations in very effective manner which has given sudden and drastic change in sales and profit as well and in 2016 it has put more efforts so there was stable increment but in 2017 it remained complacent which had given directly impact on their financials which can be easily observed in both context such as sales and profit (Dhavale and Sarkis, 2018).
3.3 Poster presentation
Findings are enclosed in poster.
3.4 Preparing formal report for Retail Times Magazines
|
To: Retail Times Magazine The operation of business are reflected via transforming them into gain to organization. The special emphasis has been put upon purchasing products through online rather than buying from physical outlet. The factor convenience is main reason for this preference as in present scenario, all have busy work schedule. The operations of retail segment has been set with requirement of consumer and some particular goods and services must be identified for this purpose. In the present era, consumers are giving more attention to customised goods and services, it has been observed by the outcomes of survey. By tracking the result of survey it has different alterations in context of operations related to that specific activity. The questionnaire helps in identifying various issues and especially the change has been recorded such as trend declination of sales revenue, online preference is higher than physical stores and 56% population is giving special emphasis on level of convenience. The main aspect has been stated which is regarding purchases and price fluctuations. |
TASK 4
4.1 Describing characteristics of various information system
Transaction Process System: It is also referred as real time processing as it is generally used at operational level. It is type of information system which manages data created in daily operations. It consists of processing, formatting, storing, creating and retrieving some new aggregate data. It is a style for computing which divides work of into separate individual and operations which are indivisible known as transactions. It is a server system which combine software and hardware which supports processing of every transaction. For processing daily transactions of business this information system is designed. It takes time but very cost efficient by repeating operations in huge volume (Stine and Foster, 2017). It interfaces with other information system in organization like EIS, DSS and IRS. Usually it had centred in every transaction of accounting and finance (Wan and et. al., 2014).
The main aim of TPS is to generate processed data about every transaction as it maintains very high degree of accuracy. The data has been ensured with information accuracy and integrity. It helps in preparing documents and reports in perfect time. It helps in increasing labour efficiency and gives service in very enhanced manner. For accomplishing competitive advantage customer loyalty has been build and maintained. In the series of characteristics it is used for processing huge amount of data. Usually sources of data is internal and results are gained for internal members. The processing of information can be on monthly, weekly or even daily basis as well. There is requirement of high processing speed because of huge volume. The past data is gathered and monitored as input and out data is well standardised. The complexity of low computation is an evident in this information system. There is requirement of high level of accuracy, security and data integration along with high reliability and one component is very compulsory such as inquiry processing.
Management information system: It is set of system which is used for taking better decisions by giving all the essential information to managers. It helps in giving information with context of different issues for improving quality of decision making for management. The information which is extracted is very accurate and fast which is supplied by MIS and quicker decisions are undertaken by increasing level of quality in decision making which added to bottom line of organization. Generally it is used by mangers for conducting task with great ease and efficiency as it will directly reflect in productivity of organization. The most essential contribution to company is that it provides better connectivity with rest of company (Crosby, Devaney and Wyatt, 2018).
Its characteristics are generic in nature as it is drafted in top down approach as it can be signified in requirements by management at various level of information. It gives special emphasis on satisfying information requirement of management. The designing process of MIS involves whole management as it has involvement and continuously reviewed and updated for developing good qualitative system. It helps in decreasing gap between various expectations of management which creates actual system. It is indicated as integrated system which is directly incorporated with several functional and operational activities of management. It is one of the most essential feature and requirement for qualifying as MIS. The reason behind integrated system that whole information is in managerial context for decision making which might be required for other areas of management within the organisation. It gives whole picture of scenario or full information which can be only provided by integrated system.
Decision support system: It is replicated as information system which helps the whole management for taking decision. It is an intelligence system which gives direction to management for taking decision in context of solving all unstructured problems. As this system is generally used by managerial level which can be easily designed and adopted for improving to take ideas in process of decision making. It has its huge importance for management due to its no programming which will be helping every manager for learning new techniques and style. The manager uses this information for analysing risk which is involved in this and it will be and major factor for deciding the excellent model for solving issues in decision making process.
This support system incorporate both models and data as well. Generally it is designed for assisting managers in process of decision of semi structured and unstructured task. It supports managerial judgement instead of replacing it as it increases effectiveness but not the level of efficiency. It has ability for finding solutions of very complex problems which cannot be easily solved by any other computerized approaches. Usually it performs quantitative analysis in very short time (Decision support system,2018).
4.2 identifying critical path with context of network diagram
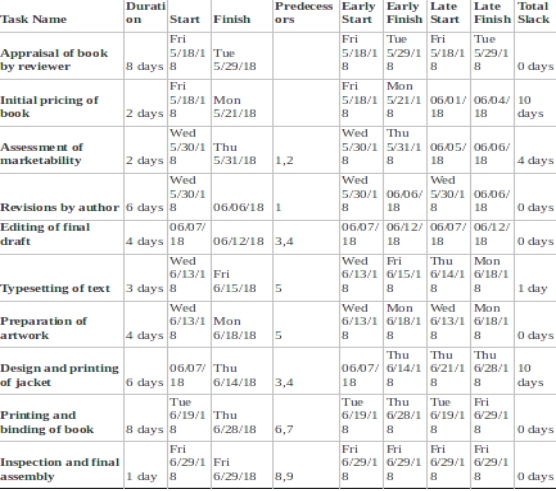
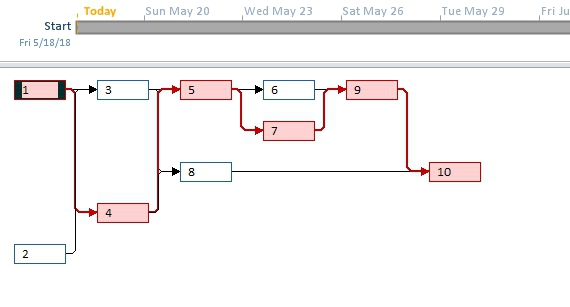
Justifying duration of critical path
Path: 1 – 4 – 5 – 7 – 9 – 10
Duration (Days): 8+6+4+4+8+1 = 31 days
The is giving brief representation of critical path with its specified duration in very best possibility and it has ability for distributing books in 31 days. As if there is any difficulty while performing this network which will lead to skip of activity or delayed then whole network will be affected which will be affecting in negative manner. So network diagram should be followed in very appropriate manner for accomplishing its goals and objectives.
4.3 Application of financial tools for decision making
Net present value: It is refereed as present value of expected cash flow investment with its difference from cost of acquiring investments. Generally it has its applicability for analysing decision regarding investment which will be depicting clear picture about valuation of new investment. If the investment is giving positive outcome then it will add value to organization along with benefiting shareholders and if it is negative than vice versa (Net present value,2018).
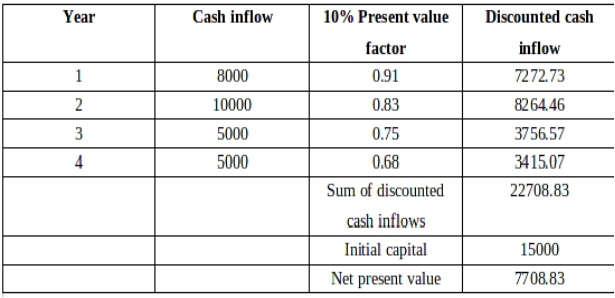
Interpretation: The above table is giving clear view of its cash flow with its discounting factor that is 10%. According to its initial capital and discounted cash flow is giving outcome of 7708.83 which is positive so it can be interpreted as investment is accepted with additional value.
Internal Rate of return: It is replicated as discount rate which will be making net present value of any specific project as zero. In simple words it can be elaborate as expected rate of return which will be earned in context of any project or investment. It is used by many organizations on different projects for raising their revenue or to cut down costs. Any start up has necessity of investing in product which is developed for accomplishing its goals.
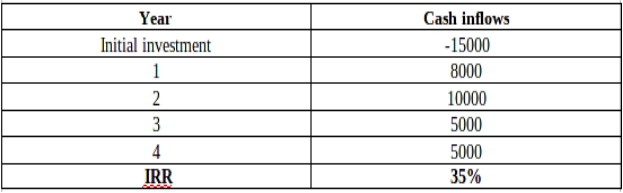
Interpretation: The above table is depicting Internal rate of return with proper analysis that is giving 35% return which has it's directly association with specified investment plan and it is incurring advantage so it must be accepted (Bohler, Krishnamoorthy and Larson, 2017).
We believe in serving our customers with the most reliable assignment help
Get dissertation writing help from dissertation writers of Instant Assignment Help Australia at the best price.
CONCLUSION
From the above report it can be concluded that decision making is very important concept in business. It had shown importance of primary and secondary data in any research title and in this report it had framed its reflection on multichannel shopping for high street malls. The questionnaire has given huge impact in finding issues so it can be directly evaluated and corrected as soon as possible. It has shown significance of various graphs, trend lines in giving its interpretation by using spreadsheets. Further it has discussed the evaluation by finding mean, mode and median which has given the best possible outcome. For understanding of growth and trend line, sales and cost of Debenhames Plc. has been recorded and interpreted. It had shown relevance of different information system such as transactional processing, Management information and decision support making in context of taking decision even at managerial level. All the information system are highly recommendable at every level of management as they will be tracking progress of finding of project along with analysing critical path and implementation of different investment appraisal techniques.
Students Also Like to Read: Research Project Talon Outdoor
REFERENCES
- Bohler, J., Krishnamoorthy, A. and Larson, B., 2017. The Financial and Non-financial Aspects of Developing a Data-Driven Decision-Making Mindset in an Undergraduate Business Curriculum.The E-Journal of Business Education & Scholarship of Teaching.11(1). p.85.
- Crosby, N., Devaney, S. and Wyatt, P., 2018. The implied internal rate of return in conventional residual valuations of development sites.Journal of Property Research.pp.1-18.
- Daigle, H., 2016. Application of critical path analysis for permeability prediction in natural porous media.Advances in Water Resources.96. pp.43-54.
- Dhavale, D. G. and Sarkis, J., 2018. Stochastic internal rate of return on investments in sustainable assets generating carbon credits.Computers & Operations Research.89. pp.324-336.

UPTO50%
Avail The Benefit Today!
To View this & another 50000+ free