Introduction
Financial analysis can be defined as the process of evaluating and assessing different aspects of a company. These are projects, budgets, financial performance etc. It is mainly used to figure out that an organisation is in a good condition or not and also guides to evaluate performance of the business. There are various types of analysis that are used by enterprises these are vertical, horizontal, growth, leverage, profitability, efficiency etc. Strategic decisions regarding investment are formed with the help of it. Purpose of this project report is to understand the business environment of Petronas Gas BHD which is also known as Petroliam nasional Berhad (National Petroleum Limited) and its market position. Another purpose is to conduct a competitive analysis of financial performance of Petronas Gas and Sapura Energy. The detailed investigation of both the companies is done to make buying decision of shares.
In this project report a comparative financial performance analysis is going to be conducted for two different organisations with the help of different ratios. A summary of this assessment, justification regarding buying decision, problems or limitations of ratio analysis and assumptions that are made by a investor to form the decision.
Increase Your Odds of Success With Our
- Scholastic academic documents
- Pocket friendly prices
- Assured reliability, authenticity & excellence
1. Background And Position of The Company In The Industry
Petronas Gas Bhd is a Malaysian oil and gas organisation which was founded in year 1974 and owned by the legal authorities of Malaysia. It has ranked among world's top 500 largest corporations. The company has also ranked as the world's 12thmost profitable entity and in Asia it is on the first number. Its headquarter is in Kuala Lumpur, Malaysia. Currently Petronas is executing its business all around the world but mainly in its home country. The products and services that are offered by it are petroleum, natural gas, petrochemicals, filling station and shipping. Currently more than 51000 employees are working in the enterprise that are providing services worldwide and strength of workforce within the nation is more than 2100. There are various subsidiaries of the organisation these are KLCC property holdings, Petronas Gas, Daganagan, Chemicals, Port, Misc etc. It was incorporated in year 1983 and listed on market of Bursa Malaysia Securities Berhad in year 1995.
Position of the company is very good in its industry because it is the most profitable organisation in whole Asia As compare to its competitor which is Sapura Energy. Petronas Gas has high sustainability as it focuses on different key aspects such as shareholder's value, national resources use, climate change, biodiversity, health, safety and environment, product stewardship and societal needs that helps it to be on the top of its industry. Standard of corporate governance of the company is also very high because the board members has achieved higher ratings for its professionalism and business ethics wit the help of its operational activities. According to BMCC oil and gas sector in Malaysia contributes almost 20% in its GDP and it has been forecasted that the industry will grow with the rate of 5% annually.
2. Five Year Comparative Financial Performance Analysis Using Ratios
Ratio analysis:It is a process in which different types of financial information is used to analyse performance of a company. Overall profitability, liquidity, efficiency etc. can be determined with the help of ratios. Various types of ratios that are described below are calculated for Petronas Gas and Sapura Energy to compare financial performance of both the companies.
Profitability ratios:These ratios are calculated to evaluate profitability of an organisation. It helps to analyse ability of a company to generate income against its expenses and spendings.
- Gross margin ratio:This ratio is mainly used to compare gross profits of the company with net sales. It shows the percentage of gross margin which is generated form the revenues in a particular time period.
- Net margin ratio:It is calculated to analyse the percentage of net profits which is generated against the sales of an accounting year. Purpose of calculating this ratio is to assess profitability of the company.
- Return on capital employed ratio:Such type of ratio is used to determine efficiency and profitability of an organisation against the investments that are made by it in a particular time period. It is very important for the companies to keep their ROCE high from the rate at which the entity borrows money.
Liquidity ratios:These ratios are mainly calculated to determine liquidity and financial status of a company. It guides stakeholders to analyse that organisations are having appropriate funds to operate business or not.
- Current ratio:It shows capability of a company to pay out all its short term liabilities with the help of current assets in one year. If it varies from 1.5 to 2 then it will be considered as a good ratio.
- Quick ratio:It calculated to determine the ability of the company to pay all the short term liabilities with the help of quick assets in less then one year. Ideal quick ratio is 1 for all the companies.
Capital structure or gearing ratios:These ratios are calculated by the organisations in order to compare equities with different aspects of balance sheet such as debts, total assets etc.
- Debt equity ratio:This ratio is used to analyse the proportion of equities and external debts that are invested in the organisation's operational activities. The ideal debt equity ratio for gas industry is 1 which means that shareholder's funds and debts are equally used to execute business.
- Equity ratio:It is calculated to determine relationship between total assets and equities of a company which shows that percentage of equities that are involved in assets.
Efficiency ratios:Such type of ratios are calculated to analyse the way in which a company uses all its liabilities and assets internally. It helps to determine overall efficiency of the organisation to enhance sales.
- Total asset turnover ratio:It helps to analyse the ability to total assets to increase sales of the organisation.
- Fixed asset turnover ratio:It is used to calculate the percentage of sales which is generate with the help of fixed assets.
- Inventory turnover ratio:This ratio is used to measure the compatibility of a company to manage all its inventory.
We believe in serving our customers with the most reliable assignment help
Stock market performance ratios:These ratios are calculated to analyse performance of the company. All of them guides the investors to forecast the returns that can be provided by the organisation in future on their investment.
- Price earning ratio:It shows the relation between share prices and earning per share of a company. It helps the investors to estimate the rate of return that can be acquired by them in future. It is forecasted with the help of previous year data. For gas industry the ideal ratio is 25.4.
- Return on equity:It is used to determine the returns that are generated by a company on its funds. It shows the capability of an organisation to use investments in appropriate manner. The ratio between 15-20% is considered as a good return on equity.
- Earning per share:It is a part of total profits of a company which is allocated to the shareholders according to the number of shares that are owned by them.
- Dividend yield ratio:This ratio is shows the relationship between dividend distributed by a company and its share price. It also reflects the percentage of share price which is paid in the form of dividend to the shareholders.
All the above described ratios are calculated for Petronas Gas and its competitor Sapura Energy which is a Malaysian integrated oil and gas service providing company. It operates its business in more than 20 countries such as Chine, US, Australia etc. it is mainly based in Seri Kembangan and employing around 13000 employees. The calculations are as follows:
Financial ratios of Petronas Gas Bhd:
|
Basis |
Ratios |
Formula |
2014 |
2015 |
2016 |
2017 |
2018 |
|
Profitability ratios |
Gross margin |
Gross profit/ net sales* 100 |
49.97 |
50.36 |
48.00 |
45.30 |
44.55 |
|
Net margin |
Net profit/ net sales *100 |
53.42 |
41.96 |
44.59 |
38.13 |
37.28 |
|
|
Return on capital employed |
Net operating profit/ capital employed *100 |
15.76 |
17.18 |
14.88 |
13.77 |
13.47 |
Gross margin ratio of Petronas are fluctuating continuously these are not stable which shows that profits of the company are unsteady. Net profit margin of the organisation is very high as compare to its industry average which means it has good profitability in its sector. Industry average for net margin is 6.1%. Return on capital employed of Petronas is decreasing since year 2016 to 2018 which shows that the company has reduced its investment in itself.
Overall profitability of the company is very good as net profit margin ratio of the Petronas is high from its industry average which is 6.1%. All the ratios under this head are interrelated with each other because if gross profit changes then it will leave affect on gross margin, net margin and return on capital employed because if it decreases the other profits such as operating and net profits will get affected. These ratios are decreasing since year 2016 which shows their interlink.
|
Basis |
Ratios |
Formula |
2014 |
2015 |
2016 |
2017 |
2018 |
|
Liquidity ratios |
Current ratio |
Current assets/ current liabilities |
1.47 |
1.63 |
2.32 |
2.45 |
4.76 |
|
Quick ratio |
Quick assets/ current liabilities |
1.41 |
1.56 |
2.24 |
2.37 |
4.64 |
Current ratio of Petronas Gas was lower then ideal ratio is year 2014 and 2015 but from 2016 it has crossed the limit of ideal ratio which means the organisation has higher liquidity. Quick ratio of the company is very good and higher then the ideal ratio which is 1.
Organisation's overall liquidity is very good as current and quick ratios are continuously increasing since year 2014. Both the ratios are interlinked with each other because quick assets are a part of current assets hence if it changes then it will leave impact on both the ratios. It is very beneficial for the investors because there are more then sufficient funds in Petronas Gas and they will get good returns on their investment.
|
Basis |
Ratios |
Formula |
2014 |
2015 |
2016 |
2017 |
2018 |
|
Capital structure or gearing ratios |
Debt equity ratio |
External liabilities/ internal liabilities |
0.29 |
0.26 |
0.26 |
0.38 |
0.41 |
|
Equity ratio |
Equities/ total assets |
0.78 |
0.79 |
0.80 |
0.72 |
0.71 |
Debt equity ratio of Petronas is very low as compare to industry average which means that organisation is using internal funds for operations rather then debts. Equity ratio of the company fluctuating and it shows that more assets are purchased from shareholder's equities rather then debts.
Capital structure of Petronas Gas is not good as its debt equity and equity ratios both are not showing a good position. It is using internal funds for its operations and purchases rather then external funds such as debts. Both the ratios are interlinked because if equities fluctuates then these ratios may get affected due to this as they show relation between debts, assets and shareholder's funds.
|
Basis |
Ratios |
Formula |
2014 |
2015 |
2016 |
2017 |
2018 |
|
Efficiency ratios |
Total asset turnover |
Sales/ total assets |
0.29 |
0.33 |
0.31 |
0.28 |
0.27 |
|
Fixed asset turnover |
Sales/ fixed assets |
0.34 |
0.37 |
0.36 |
0.33 |
0.34 |
|
|
Inventory turnover ratio |
Sales/ Inventory |
99.79 |
102.14 |
96.87 |
67.07 |
71.79 |
Total assets turnover ratios show fluctuations it takes place due to changes in sales and assets of the company. Changes in fixed assets has resulted in vacillation in its relation with organisation's sales. Inventory turnover ratio of Petronas Gas was decreased in 2016 and 2017 but at the end of 2018 it has again started to increase.
Petronas Gas has an average efficiency to because continuous fluctuations have been recorded in above calculated ratios. All of them are interlinked with each other because they are based upon net sales which was generated by the company in a specific time period.
|
Basis |
Ratios |
Formula |
2014 |
2015 |
2016 |
2017 |
2018 |
|
Stock market performance ratios |
Price earning ratio |
Share price/ EPS |
22.66 |
24.72 |
21.91 |
22.49 |
19.69 |
|
Return on equity |
Net profit/ shareholder's equity |
0.20 |
0.17 |
0.17 |
0.15 |
0.14 |
|
|
Earning per share |
Net profit/ weighted average shares |
1.05 |
0.93 |
1.00 |
0.88 |
0.91 |
|
|
Dividend yield ratio |
Dividend per share/ share price *100 |
2.10 |
3.48 |
2.64 |
3.04 |
3.70 |
Price earning ratio of Petronas is reflecting changes and reason behind this is changes in share price and EPS. Return on equity is continuously decreasing which shows that overall returns of the company are declining year by year. Earning per share is showing fluctuations which means income on each share is varying every year. Dividend yield of Petronas has been increased in 2017 and 2018 which means in this period higher incomes are received by the external parties of the company as compare to previous years.
Price earning ratio, return on equity, EPS and dividend yield ratios are showing fluctuations which means stock market performance is not stable. All of them are interrelated with each other because these are based upon share price, equities or EPS, If one elements changes then it may result in fluctuations in all of them.
Financial ratios of Sapura Energy:
|
Basis |
Ratios |
Formula |
2014 |
2015 |
2016 |
2017 |
2018 |
|
Profitability ratios |
Gross margin |
Gross profit/ net sales* 100 |
25.16 |
28.48 |
25.14 |
22.19 |
16.44 |
|
Net margin |
Net profit/ net sales *100 |
12.97 |
14.41 |
-7.78 |
2.72 |
-42.46 |
|
|
Return on capital employed |
Net operating profit/ capital employed *100 |
5.36 |
5.71 |
5.51 |
-1.89 |
1.08 |
Gross margin ratios of Sapura Energy are showing good profitability of the organisation but net margin and return on capital employed both are showing negative results of ratios which means its profitability is not compatible and it is bearing losses.
Profitability of Sapura Energy is not good because the net margin and ROCE are showing negative ratios because the company has faced losses in previous years. All the ratios are interrelated with each other as changes in sales and gross profits may result in fluctuations in other ratios.
|
Basis |
Ratios |
Formula |
2014 |
2015 |
2016 |
2017 |
2018 |
|
Liquidity ratios |
Current ratio |
Current assets/ current liabilities |
1.06 |
1.28 |
1.04 |
1.00 |
1.02 |
|
Quick ratio |
Quick assets/ current liabilities |
0.85 |
1.03 |
0.93 |
0.92 |
0.92 |
Current ratio of the company is very low as compare to ideal ratio which means the organisation is not able to pay all its current liabilities from its current liabilities. Quick ratio of Sapura is also very low it means liquidity of the organisation is weak.
Overall liquidity of Sapura is very low because current and quick ratios both are very low as compare to the ideal ratios. It means organisation does not have sufficient funds to repay all its short term liabilities. These ratios are interlinked with each other because these are based upon current liabilities if it changes then it will result in fluctuation in ratios.
|
Basis |
Ratios |
Formula |
2014 |
2015 |
2016 |
2017 |
2018 |
|
Capital structure or gearing ratios |
Debt equity ratio |
External liabilities/ internal liabilities |
1.61 |
1.88 |
1.99 |
1.86 |
2.17 |
|
Equity ratio |
Equities/ total assets |
0.38 |
0.35 |
0.33 |
0.35 |
0.32 |
Debt equity ratio of the Sapura Energy is more then industry average which is 1, it means organisation is appropriately using debts and equities. Equity ratio of the company is fluctuating but it is very low which means a few percentage of funds are used to buy assets.
Want to Join the Circles of
HIGH ACHIEERS?Make it a reality with our EXPERTS
Order NowCapital structure of the organisation is very good because it is using external liabilities more then internal liabilities for its operational activities and for assets. Shareholder's equity is appropriately utilised by the entity. Both the ratios are interlinked because there is one thing which is common in them which is equities.
|
Basis |
Ratios |
Formula |
2014 |
2015 |
2016 |
2017 |
2018 |
|
Efficiency ratios |
Total asset turnover |
Sales/ total assets |
0.31 |
0.29 |
0.28 |
0.20 |
0.20 |
|
Fixed asset turnover |
Sales/ fixed assets |
0.38 |
0.34 |
0.34 |
0.25 |
0.23 |
|
|
Inventory turnover ratio |
Sales/ Inventory |
17.75 |
15.61 |
17.80 |
16.71 |
15.64 |
Total asset turnover ratio of Sapura is decreasing since year 2014 and at last it remains stable for year 2017 and 2018. Fixed assets ratio of Sapura is also declining due to fluctuations in assets. Inventory turnover of the enterprise is fluctuating and it was reducing sine year 2017.
Efficiency of the entity is not good because all the ratios are declining continuously. All the ratios are interrelated with each other because they are calculated with the help of sales if it changes then all of them get affected due to this.
|
Basis |
Ratios |
Formula |
2014 |
2015 |
2016 |
2017 |
2018 |
|
Stock market performance ratios |
Price earning ratio |
Share price/ EPS |
23.78 |
9.86 |
-14.03 |
52.07 |
-1.29 |
|
Return on equity |
Net profit/ shareholder's equity |
0.11 |
0.12 |
-0.06 |
0.02 |
-0.26 |
|
|
Earning per share |
Net profit/ weighted average shares |
0.19 |
0.24 |
-0.13 |
0.03 |
-0.42 |
|
|
Dividend yield ratio |
Dividend per share/ share price *100 |
0.00 |
1.27 |
0.54 |
0.00 |
1.83 |
Price earning, return on equity and EPS are showing negative results because organisation's overall profitability is not good. Dividend yield ratio is showing zero because in year 2014 and 2017 dividend is not provided to the shareholders.
Stock market performance of Sapura Energy is weak because all the ratios are showing negative result or zero which means the organisation is not able to provide appropriate returns to the shareholders.
3. Analysis of Financial Strength Of The Companies
Comparison of financial health:ROCE of Petronas Gas is very high as compare to Sapura Energy which means its profitability is higher. It shows that company is achieving higher returns on the investments that are made from its internal liabilities.
Financial risk of Sapura Energy is lower then Petronas because its gearing ratios are very high because it is using all the internal liabilities in more appropriate manner as compare to Petronas. Financial risk in Sapura is lower then other organisation.
Petronas is showing good return on equity then Sapura it offers higher returns to the shareholder their funds that are invested by them in the company but Sapura Energy is not providing appropriate returns on their money. Earning per share of Petronas Gas is more then the other organisation which means it is acquiring higher incomes on its shares.
Price earning ratio of Petronas is very good as compare to Sapura because it is not showing any negative result like Sapura does. This ratio shows a good stock market performance of the organisation.
Movement of share price trend of Petronas is more clear as compare to Sapura because the trend line is showing the increasing trend but in Sapura it is not clear because it is going to be consolidated. In this situation it is not possible to estimate that it will increase in future or not. Trend lines of both of them are as follows:
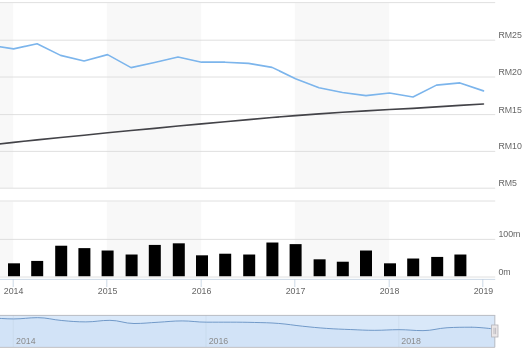
Illustration 1: Share price of Petronas Gas Bhd, 2019
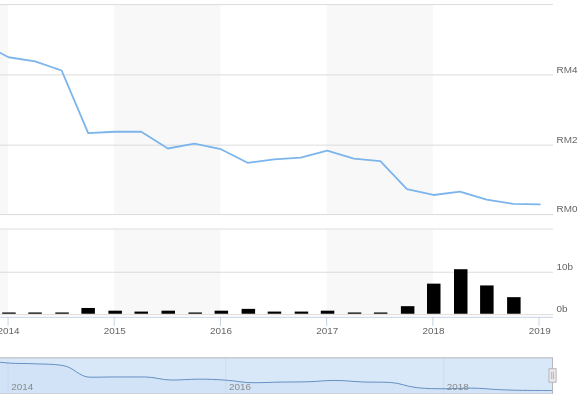
Illustration 2: Share price of Sakura Energy Bhd, 2019
From both the companies the investors will choose to invest in Petronas Gas Bhd because its profitability, liquidity and efficiency is very good as compare to Sapura Energy Bhd. It is providing good returns to the investor on their investment.
- Offering the best assignment writing help
- Delivering the orders as fast as possible
- Providing maximum satisfaction at affordable rates
4. Problems or Limitations of Ratio Analysis And Assumptions
While calculating different types of ratios or conducting ratio analysis the investor have to face different problems all of them are as follows:
- Some times appropriate data cannot be gathered by the investors as organisations does not prefer to provide each and every information to the public.
- If companies manipulates their final accounts then it is not possible to get accurate results and wrong decisions can be formulated by the investors and shareholders regarding investing their money.
- All the figures that are reflected in final accounts are based on book value actual value is not recorded in them so it results in inaccurate ratios that are not appropriate.
- Different organisations implement different accounting principles while recording financial information so it is not possible to conduct an proper comparison between two companies.
Conclusion
From the above assignment it has been concluded that there are different types of ratios such as liquidity, capital structure, stock market performance etc. are also used for the purpose of financial analysis. All the investors who are going to invest their money in a company always try to find out actual potential of it so that they may get higher returns on their investment. It is very important for shareholders to evaluate performance of the company where they have made investments because it helps to assess that their money is appropriately utilised by the organisation or not.
You may also like to read:

UPTO50%
Avail The Benefit Today!
To View this & another 50000+ free