Introduction
Financial performance management is the process which is highly concerned with taking strategic actions or decisions which directly help in growth as well as enhancing performance of the firm. In this regard, ratio analysis technique is significant which in turn aids in evaluating the financial performance and thereby assists in assessing causes of deviations (Ratio analysis, 2017). In this, measure of financial analysis helps in framing highly competent strategic and policy framework for the near future. The present report is based on different case situations which in turn develops understanding about several financial tools and techniques that help in managing the monetary aspects.
Increase Your Odds of Success With Our
- Scholastic academic documents
- Pocket friendly prices
- Assured reliability, authenticity & excellence
Question 1
Preparing a business report for the Board of directors of ARM holdings Ltd by analyzing the key ratios
|
To, Board of Directors, ARM Holdings Plc Date: 22ndFebruary, 2017 Subject: Financial performance analysis It has been reported to the higher management team that ratio analysis has been conducted with the aim to extract appropriate information from the financial statements of Arms Holding Plc. Such financial tool is effectual which in turn provides deeper insight about financial health, position and performance of the concerned business unit. Profitability ratios
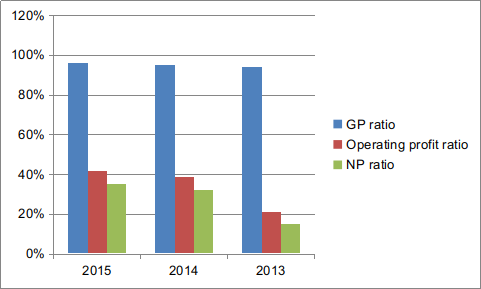
From profitability ratio analysis, it has been assessed that GP ratio of ARM Holdings Plc increased from 94% to 96% at the end of 2016. It shows that business unit has made proper control on the direct expenses. Besides this, in 2015 operating profit ratio also increased from 21% to 42%. Hence, operating profit margin of the firm inclined in 2015 with higher rate as compared to previous years. Along with this, NP margin of the company was 15% in 2013 whereas it accounted for 35% at the end of 2015. By considering such aspect, it can be stated that firm had generated enough profit over indirect expenses. Thus, from overall evaluation, it is reported to the team of higher management that profitability aspect and performance of business unit was sound during such period(Chwieroth, 2015). Liquidity ratios
Tabular presentation clearly entails that the output of both current and quick ratio exceeded ideal measure. Moreover, according to ideal ratio current and quick ratio must be 2:1and .5:1 (Mateen and More, 2013). From financial statement analysis, it has been found that company‘s asset level increased significantly and thereby capability in relation to making payment of financial obligations from 2.78 to 3.61. On the other side, quick ratio of the firm also increased from 2.69 to 3.50 which mean that business unit had more current assets which can easily be convertible into cash for fulfilling the monetary obligations. Hence, liquidity aspect of the concerned business organization was sound from the year 2013 to 2015. However, for enhancing the return and thereby financial performance, company is required to invest money in other profitable investment opportunities rather than keeping with itself. Efficiency ratios
By conducting ratio analysis, it has been identified that total asset turnover ratio was 0.44, 0.43 & 0.46 respectively from 2013-2015. Such increasing trend or pattern shows that Arms Holding Plc made optimum use of assets while carry out business activities. However, management team is required to conduct training and programs for employee motivation. This in turn helps the business unit in enhancing efficiency and thereby profitability aspect of personnel (Lam, 2010). Further, movement of inventory turnover ratio from 13.10 to 21.83 shows that stock was sold and replaced by Arms Holding Plc in 2015 more quickly. In this, by employing inventory control and management techniques, company can enhance its efficiency level or performance. Solvency ratios
Graphical presentation clearly states that in the period of 2015, solvency position of Arms Holdings Plc was sound as compared to previous years. In the accounting year 2015, debt-equity ratio of business unit was 0 .41 which was highly near to the ideal measure such as .5:1 (Landi and et.al., 2013). In contrast to this, in 2013 and 2014 such measure was 0.22 & 0.25. It presents that during such period; most of the funds were raised by the organization through equity rather than debt instruments. Thus, solvency position of organization was sound in the year 2015 and indicates that highly balanced or optimal capital structure had been maintained by Arms Holdings Plc. |


We believe in serving our customers with the most reliable assignment help
Horizontal analysis of P&L
|
Particulars |
Changes |
2015 |
Changes |
2014 |
Changes |
2013 |
|
Sales revenue |
22% |
968.3 |
11% |
795.2 |
100% |
714.6 |
|
Cost of sales |
4% |
39.3 |
-4% |
37.8 |
100% |
39.3 |
|
Gross profit |
23% |
929 |
12% |
757 |
100% |
675 |
|
General Administrative |
14% |
146.9 |
5% |
129.3 |
100% |
123 |
|
Sales and marketing |
14% |
98 |
5% |
86.2 |
100% |
82 |
|
Research & development |
19% |
278 |
-26% |
232.9 |
100% |
316.8 |
|
Operating income |
31% |
406.1 |
50% |
309 |
100% |
153.5 |
|
Finance expenses |
0% |
0.3 |
50% |
0.3 |
100% |
0.2 |
|
Finance income |
15% |
9 |
-16% |
7.8 |
100% |
9.3 |
|
Net income before tax |
31% |
414.8 |
49% |
316.5 |
100% |
162.6 |
|
taxation |
23% |
75.1 |
6% |
61.1 |
100% |
57.8 |
|
Net profit |
33% |
339.7 |
59% |
255.4 |
100% |
104.8 |
Horizontal balance sheet analysis
|
Particulars |
Changes |
2015 |
Changes |
2014 |
Changes |
2013 |
|
|
Sales revenue |
100% |
968.3 |
100% |
795.2 |
100% |
714.6 |
|
|
Cost of sales |
4% |
39.3 |
5% |
37.8 |
5% |
39.3 |
|
|
Gross profit |
96% |
929 |
95% |
757 |
94% |
675 |
|
|
General Administrative |
15% |
146.9 |
16% |
129.3 |
17% |
123 |
|
|
Sales and marketing |
10% |
98 |
11% |
86.2 |
11% |
82 |
|
|
Research & development |
29% |
278 |
29% |
232.9 |
44% |
316.8 |
|
|
Operating income |
42% |
406.1 |
39% |
309 |
21% |
153.5 |
|
|
Finance expenses |
0% |
0.3 |
0% |
0.3 |
0% |
0.2 |
|
|
Finance income |
1% |
9 |
1% |
7.8 |
1% |
9.3 |
|
|
Net income before tax |
43% |
414.8 |
40% |
316.5 |
23% |
162.6 |
|
|
taxation |
8% |
75.1 |
8% |
61.1 |
8% |
57.8 |
|
|
Net profit |
35% |
339.7 |
32% |
255.4 |
15% |
104.8 |
Horizontal analysis of balance sheet
|
Current Assets |
In % |
2015 |
In % |
2014 |
In % |
2013 |
|
Cash and Short Term Investments |
1% |
681.4 |
13% |
674.9 |
100% |
589.1 |
|
Trade Receivables |
38% |
229.5 |
3% |
166.8 |
100% |
161.2 |
|
Inventory |
-33% |
1.8 |
-10% |
2.7 |
100% |
3 |
|
Prepaid Expenses |
20% |
28.7 |
10% |
23.9 |
100% |
21.7 |
|
Other Current Assets |
165% |
6.9 |
-49% |
2.6 |
100% |
5.1 |
|
Total Current Assets Non-Current Assets |
948.3 |
870.9 |
100% |
780.1 |
||
|
100% |
||||||
|
Property/Plant/Equipment |
42% |
61.6 |
29% |
43.4 |
100% |
33.6 |
|
Goodwill |
15% |
650.7 |
8% |
567 |
100% |
525.9 |
|
Intangibles |
19% |
92 |
-7% |
77.2 |
100% |
82.9 |
|
Long Term Investments |
-47% |
14.2 |
31% |
26.7 |
100% |
20.4 |
|
Other Long Term Assets |
40% |
353.4 |
29% |
252 |
100% |
195.5 |
|
Total Non-Current Assets |
21% |
1,171.90 |
13% |
966.3 |
100% |
858.3 |
|
Total Assets |
15% |
2,120.20 |
12% |
1,837.20 |
100% |
1,638.40 |
|
Current Liabilities |
||||||
|
Trade Payable |
9% |
12.7 |
67% |
11.7 |
100% |
7 |
|
Accrued Expenses |
45% |
100.7 |
-21% |
69.4 |
100% |
88.1 |
|
Notes Payable/Short Term Debt |
0 |
0 |
100% |
0 |
||
|
Current Port. of LT Debt/Capital Leases |
33% |
5.2 |
44% |
3.9 |
100% |
2.7 |
|
Other Current liabilities |
-18% |
143.9 |
-4% |
175.3 |
100% |
182.5 |
|
Total Current Liabilities Non-Current Liabilities |
1% |
262.5 |
-7% |
260.3 |
100% |
280.3 |
|
Provisions |
135% |
6.1 |
73% |
2.6 |
100% |
1.5 |
|
Long Term Debt |
74% |
11.3 |
55% |
6.5 |
100% |
4.2 |
|
Other Liabilities |
8% |
42.7 |
-4% |
39.5 |
100% |
41 |
|
Total Non-Current Liabilities |
24% |
60.1 |
4% |
48.6 |
100% |
46.7 |
|
Total Liabilities |
4% |
322.6 |
-6% |
308.9 |
100% |
327 |
|
Shareholders’ Equity |
||||||
|
Common Stock |
0 |
0.7 |
0 |
0.7 |
100% |
0.7 |
|
Additional Paid-In Capital |
9% |
27.2 |
38% |
24.9 |
100% |
18.1 |
|
Retained Earnings |
18% |
1,769.70 |
16% |
1,502.70 |
100% |
1,292.60 |
|
Total Equity |
18% |
1,797.60 |
17% |
1,528.30 |
100% |
1,311.40 |
|
Total Liabilities & Shareholders' Equity |
15% |
2,120.20 |
12% |
1,837.20 |
100% |
1,638.40 |
Vertical analysis of balance sheet
|
Current Assets |
In % |
2015 |
In % |
2014 |
In % |
2013 |
|
Cash and Short Term Investments |
32% |
681.4 |
37% |
674.9 |
36% |
589.1 |
|
Trade Receivables |
11% |
229.5 |
9% |
166.8 |
10% |
161.2 |
|
Inventory |
0% |
1.8 |
0% |
2.7 |
0% |
3 |
|
Prepaid Expenses |
1% |
28.7 |
1% |
23.9 |
1% |
21.7 |
|
Other Current Assets |
0% |
6.9 |
0% |
2.6 |
0% |
5.1 |
|
Total Current Assets Non-Current Assets |
45% |
948.3 |
47% |
870.9 |
48% |
780.1 |
|
0% |
0% |
0% |
||||
|
Property/Plant/Equipment |
3% |
61.6 |
2% |
43.4 |
2% |
33.6 |
|
Goodwill |
31% |
650.7 |
31% |
567 |
32% |
525.9 |
|
Intangibles |
4% |
92 |
4% |
77.2 |
5% |
82.9 |
|
Long Term Investments |
1% |
14.2 |
1% |
26.7 |
1% |
20.4 |
|
Other Long Term Assets |
17% |
353.4 |
14% |
252 |
12% |
195.5 |
|
Total Non-Current Assets |
55% |
1,171.90 |
53% |
966.3 |
52% |
858.3 |
|
Total Assets |
100% |
2,120.20 |
100% |
1,837.20 |
100% |
1,638.40 |
|
Current Liabilities |
||||||
|
Trade Payable |
4% |
12.7 |
4% |
11.7 |
2% |
7 |
|
Accrued Expenses |
31% |
100.7 |
22% |
69.4 |
27% |
88.1 |
|
Notes Payable/Short Term Debt |
0% |
0 |
0% |
0 |
0% |
0 |
|
Current Port. of LT Debt/Capital Leases |
2% |
5.2 |
1% |
3.9 |
1% |
2.7 |
|
Other Current liabilities |
45% |
143.9 |
57% |
175.3 |
56% |
182.5 |
|
Total Current Liabilities Non-Current Liabilities |
81% |
262.5 |
84% |
260.3 |
86% |
280.3 |
|
0% |
0% |
0% |
||||
|
Provisions |
2% |
6.1 |
1% |
2.6 |
0% |
1.5 |
|
Long Term Debt |
4% |
11.3 |
2% |
6.5 |
1% |
4.2 |
|
Other Liabilities |
13% |
42.7 |
13% |
39.5 |
13% |
41 |
|
Total Non-Current Liabilities |
19% |
60.1 |
16% |
48.6 |
14% |
46.7 |
|
Total Liabilities |
100% |
322.6 |
100% |
308.9 |
100% |
327 |
|
Shareholders’ Equity |
||||||
|
Common Stock |
0% |
0.7 |
0% |
0.7 |
0% |
0.7 |
|
Additional Paid-In Capital |
2% |
27.2 |
2% |
24.9 |
1% |
18.1 |
|
Retained Earnings |
98% |
1,769.70 |
98% |
1,502.70 |
99% |
1,292.60 |
|
Total Equity |
100% |
1,797.60 |
100% |
1,528.30 |
100% |
1,311.40 |
|
Total Liabilities & Shareholders' Equity |
100% |
2,120.20 |
100% |
1,837.20 |
100% |
1,638.40 |
Interpretation: From horizontal analysis, it has been assessed that high growth has been witnessed in the sales revenue, gross and net profit margin. Sales revenue of the firm reached at 22% at the end of 2015. Besides this, percentage change of GP and NP was 23% & 33% respectively. Thus, by considering this it can be stated that ARM Holding Plc has performed its business activities and functions more effectually. Along with this, analysis also shows that ARM Holdings Plc had enough assets for fulfilling the obligations.
Want to Join the Circles of
HIGH ACHIEERS?Make it a reality with our EXPERTS
Order NowQuestion 2
On the basis of cited case situation, Tuesday is a small restaurant chain which is planning to expand its business operations and functions.
Option 1
If business unit does not take premises on lease then profit will be:
|
Birmingham (£) |
Tyseley (£) |
Solihull (£) |
Stirchley (£) |
|
|
Food revenue |
160,000 |
60,000 |
55,000 |
78,000 |
|
Drinks revenue |
270,000 |
128,000 |
164,000 |
145,000 |
|
total |
430,000 |
188,000 |
219,000 |
223,000 |
|
Food costs |
110,000 |
45,000 |
50,000 |
60,500 |
|
Drink costs |
-72,000 |
-25,000 |
-30,000 |
-25,000 |
|
Staff costs |
137,500 |
77,000 |
84,750 |
85,750 |
|
Overhead costs |
36,000 |
23,500 |
22,000 |
18,000 |
|
211,500 |
120,500 |
126,750 |
139,250 |
|
|
Profit/(loss) |
218,500 |
67,500 |
92,250 |
83,750 |
Option for Soilhull restaurant
|
Particulars / year |
1 |
2 |
3 |
4 |
5 |
|
Food Revenue |
56100 |
57222 |
58366.44 |
59533.77 |
60724.44 |
|
Drink revenue |
167280 |
170625.6 |
174038.1 |
177518.9 |
181069.3 |
|
Food cost |
52000 |
54080 |
56243.2 |
58492.93 |
60832.65 |
|
Drink cost |
31200 |
32448 |
33745.92 |
35095.76 |
36499.59 |
|
Staff cost |
22000 |
22660 |
23339.8 |
24039.99 |
24761.19 |
|
Overhead cost |
61800 |
63654 |
65563.62 |
67530.53 |
69556.44 |
|
Depreciation |
73750 |
73750 |
73750 |
73750 |
73750 |
|
Total sales revenue (food + drink revenue) |
223380 |
227847.6 |
232404.6 |
237052.6 |
241793.7 |
|
Total expenses (all expenditure + depreciation) |
240750 |
246592 |
252642.5 |
258909.2 |
265399.9 |
|
Profit (Revenue – expenses) |
-17370 |
-18744.4 |
-20238 |
-21856.6 |
-23606.2 |
|
Add: Depreciation |
73750 |
73750 |
73750 |
73750 |
73750 |
|
Cash inflow |
56380 |
55005.6 |
53512.01 |
51893.44 |
50143.83 |
Computation of cash inflow for Soilhull restaurant
|
Years |
Cash inflow |
PV factor @ 10% |
Discounted cash inflow |
|
1 |
56380 |
0.909 |
51249.42 |
|
2 |
55005.6 |
0.826 |
45434.63 |
|
3 |
53512.012 |
0.751 |
40187.52 |
|
4 |
51893.43564 |
0.683 |
35443.22 |
|
5 |
50143.82543 |
0.621 |
31139.32 |
|
Total discounted cash inflow |
203454.1 |
||
|
Initial investment |
295000 |
||
|
NPV |
-91545.9 |
Interpretation or recommendation: From the above evaluation, it has been assessed that Tuesday’s restaurant chain which is established in Brimingham and Soilhull is enjoying huge profit margin as compared to other locations. Further, from the overall evaluation, it has also been assessed that owner of restaurant will attain negative NPV such as £91545.9 respectively. Hence, it can be stated that Tuesday’s restaurant chain should avoid opening another unit in Soilhull.
- Offering the best assignment writing help
- Delivering the orders as fast as possible
- Providing maximum satisfaction at affordable rates
Question 3
a. Issue more debentures
Computation from debt-equity ratio
|
Particulars |
Amount (in £) |
|
Debentures |
50000 |
|
Shareholders’ equity |
48000 |
|
Debt-equity ratio |
1.04 |
By considering the present solvency position, it is recommended to Magic Works do not issue of shares. Moreover, debt-equity position of the business unit is higher than the ideal ratio such as .5:1. It reflects that business unit has generated most of the funds from debt instruments rather than the equity. Hence, interest burden of the firm will increase if it issues more debt. This in turn closely influences the working capital and thereby overall financial position of the organization (Weber and Fried, 2011). Hence, company avoids issuing debt instruments because this in turn will impose burden in front of it.
b. Sell their investment
Given financial statement presents that book value of investment is £45000. On the other side, market value of investment is £30000 which shows that if business unit sells their investment then it will suffer loss of £15000. This aspect clearly shows that by selling investment, Magic Works would not be able to generate fund for the expansion purpose. Thus, Magic Works should avoid such source while taking decision in relation to enhancing fund.
c. Company is allowed to make all sales on credit or not
By dividing net sales from trade receivables, it has been assessed that Magic Works will receive money from debtors within the period of 24 days. Hence, by collecting money from debtors within the less time frame company can meet its financial requirement to the significant level (Koller, Goedhart and Wessels, 2010).
d. Issue more ordinary shares
From financial statement analysis, it has been assessed that MagicWorks need to place emphasis on issuing more shares. On the basis of the cited case situation, business unit requires £50m for the expansion purpose. In this, by issuing shares to the general public at large, the company can generate enough amount of finance. Moreover, investors are always ready to invest money in the venture or firm which is continuously growing and offers high return. It is the most effectual sources of finance in which the company offers dividend to the shareholders when it generates enough profit. Thus, by raising fund from shares MagicWorks can enhance share capital as well as premium. Further, by generating finance through equity shares, the organization can build suitable capital structure in line with the ideal ratio.
If Magic Works raise £50 million through the means of equity shares then ideal ratio would be:
Calculation of debt-equity ratio
|
Particulars |
Amount (in £) |
|
Debentures |
50000 |
|
Shareholders’ equity |
98000 |
|
Debt-equity ratio |
.51 |
Hence, the above table shows that if business unit raises fund such as £50 million by issuing ordinary shares, then it would be able to attain ideal ratio such as .5:1 (Barlow, Roehrich and Wright, 2013).This in turn helps the company in building and maintaining highly effective capital structure.
Recommendation: From overall evaluation, it is recommended to MagicWorks to employ equity source for generating fund. This in turn enables the firm to reduce burden of debt and interest. In this way, such source will aid the corporate in enhancing profit margin to the significant level.
Conclusion
From the above report, it has been concluded that by employing technique of ratio analysis, it provides high level of assistance in managing financial resources. Besides this, it can be inferred that financial health and performance of ARM Holdings Plc was sound during the period of 2014 and 2015. Further, it has been articulated from the report that strategic and policy framework of business unit was sound during such period. It can be revealed from the report that MagicWorks Ltd needs to place emphasis on undertaking equity source and trade receivables. By this, the organization can enhance its solvency position or aspect to a great extent and thereby it would become able to get desired level of outcome or success.
You may also like to read:
References
Books and Journals
- Barlow, J., Roehrich, J. and Wright, S., 2013. Europe sees mixed results from public-private partnerships for building and managing health care facilities and services.Health Affairs.32(1). pp.146-154.
- Chwieroth, J. M., 2015. Managing and transforming policy stigmas in international finance: Emerging markets and controlling capital inflows after the crisis.Review of International Political Economy.22(1). pp.44-76.
- Koller, T., Goedhart, M. and Wessels, D., 2010.Valuation: measuring and managing the value of companies(Vol. 499). john Wiley and sons.
- Lam, W., 2010. Funding gap, what funding gap? Financial bootstrapping: supply, demand and creation of entrepreneurial finance.International Journal of Entrepreneurial Behavior & Research.16(4). pp.268-295.
- Landi, F., and et.al., 2013. Sarcopenia and mortality risk in frail older persons aged 80 years and older: results from ilSIRENTE study.Age and ageing.42(2). pp.203-209.
- Mateen, A. and More, D., 2013. Applying TOC thinking process tools in managing challenges of supply chain finance: a case study.International Journal of Services and Operations Management.15(4). pp.389-410.
- Weber, Y. and Fried, Y., 2011. Guest Editors' Note: The role of HR practices in managing culture clash during the postmerger integration process.Human Resource Management.50(5). pp.565-570.

UPTO50%
Avail The Benefit Today!
To View this & another 50000+ free